Geodemographics - blogs and resources
Visit the Geodemographics Knowledge Base (GKB) for expert blogs and links to useful sources of geodemographic data and knowledge.

The seven years since the last census have seen a surprisingly vigorous re-colonisation of the central areas of all major British cities. Now it is in inter-war suburbs that the minority ethnic population is growing fastest.
These are the unexpected conclusions of a comparative study based on the names of virtually all UK adults comparing 2011 and 2017.
Since at least as far back as the 1930s geography and sociology undergraduates have been taught that in Anglo-Saxon cities new arrivals settle first in “melting pot” communities situated in the oldest, most central and most run down of a city’s residential areas. Through a process of “white flight” the indigenous population disperses itself to ever more distant suburban locations.
Using both personal names and family names, the Origins classification infers the cultural background of virtually all UK residents and, with a reasonable degree of reliability, associates each with one of fifty or so different cultural groupings such as Nigerian, Bangladeshi and Greek / Greek Cypriot. When the results are summarised and mapped by postcode sector a consistent pattern emerges. By contrast with the country as a whole, where the white British population has fallen by 2.54% during these six years, it has increased in most of the postcode sectors of central/inner London. The same pattern is apparent in the cores of Birmingham, Manchester, Leeds, Sheffield and Liverpool. The fastest decrease has been in suburban local authorities, in Barking and Dagenham (-9.72%), Redbridge (9.06%) and Hillingdon (7.79%).
This reversal of historical patterns is caused in part by technological change. The expansion of employment in the digital and professional services sectors has been disproportionately pronounced in central city locations. The government’s regional regeneration strategy has also prioritised investment in the cores of regional cities at the expense of smaller industrial towns.
Another factor is the growing share of households comprising single persons or childless couples, many of whom value proximity to the cultural and entertainment offering of the city centre, willingly trading the loss of a garden for the avoidance of a commute which has become increasingly expensive and fraught, whichever mode of transport that they use. Policies favouring brownfield development have also increased the number of new homes for sale and rent in central city areas and newly built outlets of national supermarket chains have replaced corner shops of the Victorian era with their limited consumer offerings.
Mapping out the share of the non-white British population highlights their particularly rapid growth in what might be described as “middle-ring” suburbs, many of them developed between the wars for lower ranking administrative staff and manual workers earning good money in new assembly plants. London boroughs such as Bexley, Enfield and Hillingdon have large stocks of this type of housing. We believe a strong reason for this growth is the imposition of a cap on housing benefits.
The transformation of these neighbourhood from white to mixed is nicely captured by charting the changing share of the ethnic profile of different Mosaic neighbourhood types between 2011 and 2017. During this period, it is in the Mosaic grouping “Liberal Opinion” that the non-white British population has grown the least, only 0.52% against a national average of 2.54%.
Other than in neighbourhoods previously dominated by minority communities, the largest percentage increase in the number of non-white British names has been in what Mosaic describes as “Suburban Mindsets”, 3.73%. More granular analysis shows that the ethnic groupings which have increased at the fastest rate in this particular sort of neighbourhood are Sikhs, Tamils and Sri Lankans.
It is not just established minority communities that are suburbanising. More recently arrived groups such as Black African and white Eastern Europeans are particularly likely to live in more suburban locations, not least because they have not lived in Britain long enough to qualify for social housing and it is in these somewhat down-at-heel neighbourhoods that formerly owner-occupied homes are increasingly rented out to groups of unrelated lodgers.
Such behaviour is similar to that which once characterised in Notting Hill and Brixton where large Victorian houses, too large any longer for a family without servants, were broken up into bedsits to house the first generation of West Indian immigrants.
Mapping the changing distribution of individual ethnic groupings in London, we see very clear evidence of particular groupings moving out along particular radial corridors, Cypriots from Stoke Newington and Green Lanes to Enfield and Cockfosters, Black Africans from Deptford to Greenwich and Thamesmead, Jews from Hampstead to Hendon, Mill Hill and now Radlett.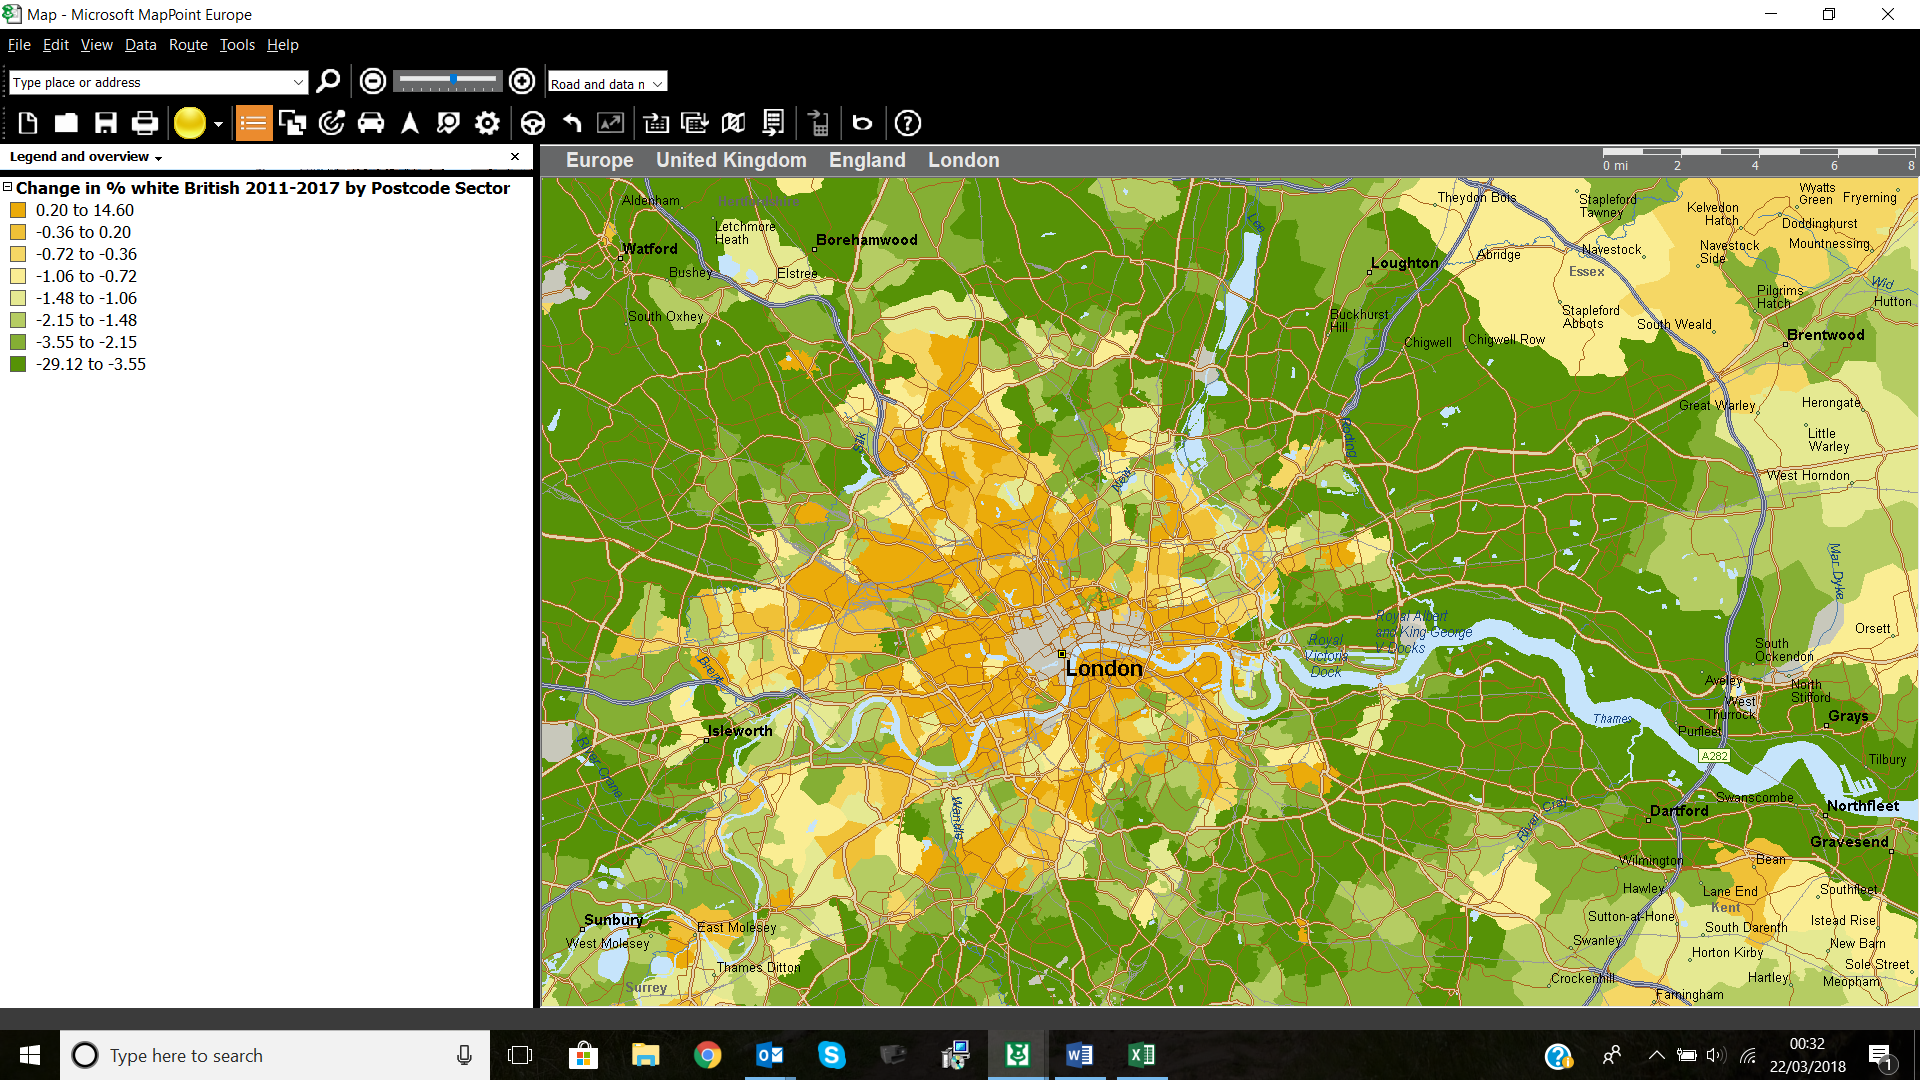
Critics are increasingly challenging social scientists over their reliance on the social survey as the default method of investigating social trends. The use of names data to track emerging patterns of migration at a fine level of granularity, both geographic and ethnic, is a good exemplar of the practical benefits using “big data”.
To claim a 20% discount on “The Predictive Postcode” simply visit www.sagepub.co.uk , add the book to your basket, and use the discount code UK16AF15 at the checkout. This offer is valid till 30/04/2018 and cannot be used in conjunction with another offer.
 |
Richard Webber is the originator of the Acorn and Mosaic postcode classification systems. He and Professor Burrows of Newcastle University are the authors of “The Predictive Postcode, the Geodemographic Classification of British Society” (Sage publications, £25). He is a Director of Webber Phillips and originator of the Origins ethno-cultural classification system. |
Any views or opinions presented are solely those of the author and do not necessarily represent those of the MRS Census and Geodemographic Group unless otherwise specifically stated.

Visit the Geodemographics Knowledge Base (GKB) for expert blogs and links to useful sources of geodemographic data and knowledge.
Our newsletters cover the latest MRS events, policy updates and research news.


©2026 The Market Research Society,
15 Northburgh Street, London EC1V 0JR
Tel: +44 (0)20 7490 4911 Email: info@mrs.org.uk
The Market Research Society (MRS) is the world's leading research association. For all those who need, generate or interpret the evidence for making good business and policy decisions. Click here to find out more about us.
©2026 The Market Research Society,
15 Northburgh Street, London EC1V 0JR
Tel: +44 (0)20 7490 4911 Email: info@mrs.org.uk