Get to Net Zero
Getting to Net Zero can be complicated and time consuming as well as often a learning curve for all involved. Here we give guidance and information that can help guide you get your research organisation to Net Zero.
Ten steps to net zero: where to start and what to do
![]()
- Switch purchased electricity to genuine 100% renewable supplies.
- Conduct energy and heat saving audits and implement reduction and efficiency strategies in buildings.
- Conduct a fleet and grey-fleet audit and put in place the strategies for decarbonisation (e.g. eco-driving and electric vehicles).
- Create a procurement policy which requires suppliers to measure and reduce their emissions and engage with them to provide help and collaboration.
- Create a company travel policy which minimises air and road travel and promotes video conferencing, rail travel and prioritises airlines with low-carbon fleets.
- Replace fossil fuel heating with heat pumps, solar thermal, district heating or electric heating.
- Avoid leaks from refrigerant through increased servicing and leak repairs. Destroy refrigerants at the end of their life.
- Reduce waste.
- Monitor and report annual emissions as part of your carbon reduction plan.
- Ensure all residual emissions are physically and permanently removed through carbon dioxide removal measures such as direct air capture and storage.
Unlocking Sustainability: Carbon footprinting for research sector organisations
![]()
The research sector has a distinct advantage over most industries when it comes to measuring and reducing its carbon footprint. In this blog by Green Element, we delve into why this sector holds a unique advantage in carbon footprinting and explore how organisations in this sector can accelerate their sustainability journey.
It is first important to understand what a carbon footprint is and how it is measured. This will help your organisation better communicate to employees, clients, and other stakeholders the importance of addressing your environmental impact.
Understanding Carbon Footprinting
A carbon footprint is the total quantity of greenhouse gases (GHG) produced by an organisation, project, or place over a given time (usually a year). GHG emissions are broken down into three categories: scope 1, scope 2, and scope 3.
GHG emissions are gases and other particles that are released into the atmosphere because of human activities, this includes the activities of your company.
Scope 1 includes all direct emissions that are generated from sources that are directly owned or controlled by an organisation, such as gases leaking from your air conditioning.
Scope 2 includes all indirect emissions from the generation of the electricity your company purchases and uses.
Scope 3 includes all indirect emissions that occur in your organisation’s value chain – so activities that you do not own or control such as business travel, working from home, employee commuting and purchased goods and services. These are usually the greatest share of your organisation’s carbon footprint.
How does this relate to the term net-zero?
The global aim of achieving net-zero emissions by 2050 to curb global warming to 1.5°C is a shared responsibility. For your organisation, net-zero translates to eliminating 90% of baseline emissions across operations and the value chain, with a maximum of 10% residual emissions. These residual emissions can be neutralised by investing in permanent physical removals projects by the net-zero target date. Examples of permanent physical removals include Ecotree, Climeworks, and Future Forest.
Setting Science-Based Targets
The journey to net-zero starts by measuring your carbon footprint. By doing this, your organisation can aim to set science-based net-zero targets to consistently reduce carbon emissions year-on-year in line with achieving net-zero by 2050, at the latest. For more information about how science-based net-zero targets work, view the new Science Based Targets Guide for Businesses published by Compare Your Footprint and Green Element.
Navigating Carbon Footprinting in the Research Sector
Organisations working within the research sector have less complex business activities in comparison to industries with intricate supply chains, manufacturing, or extensive deliveries. As a professional services operation, you will only need to focus on the following areas of the business:
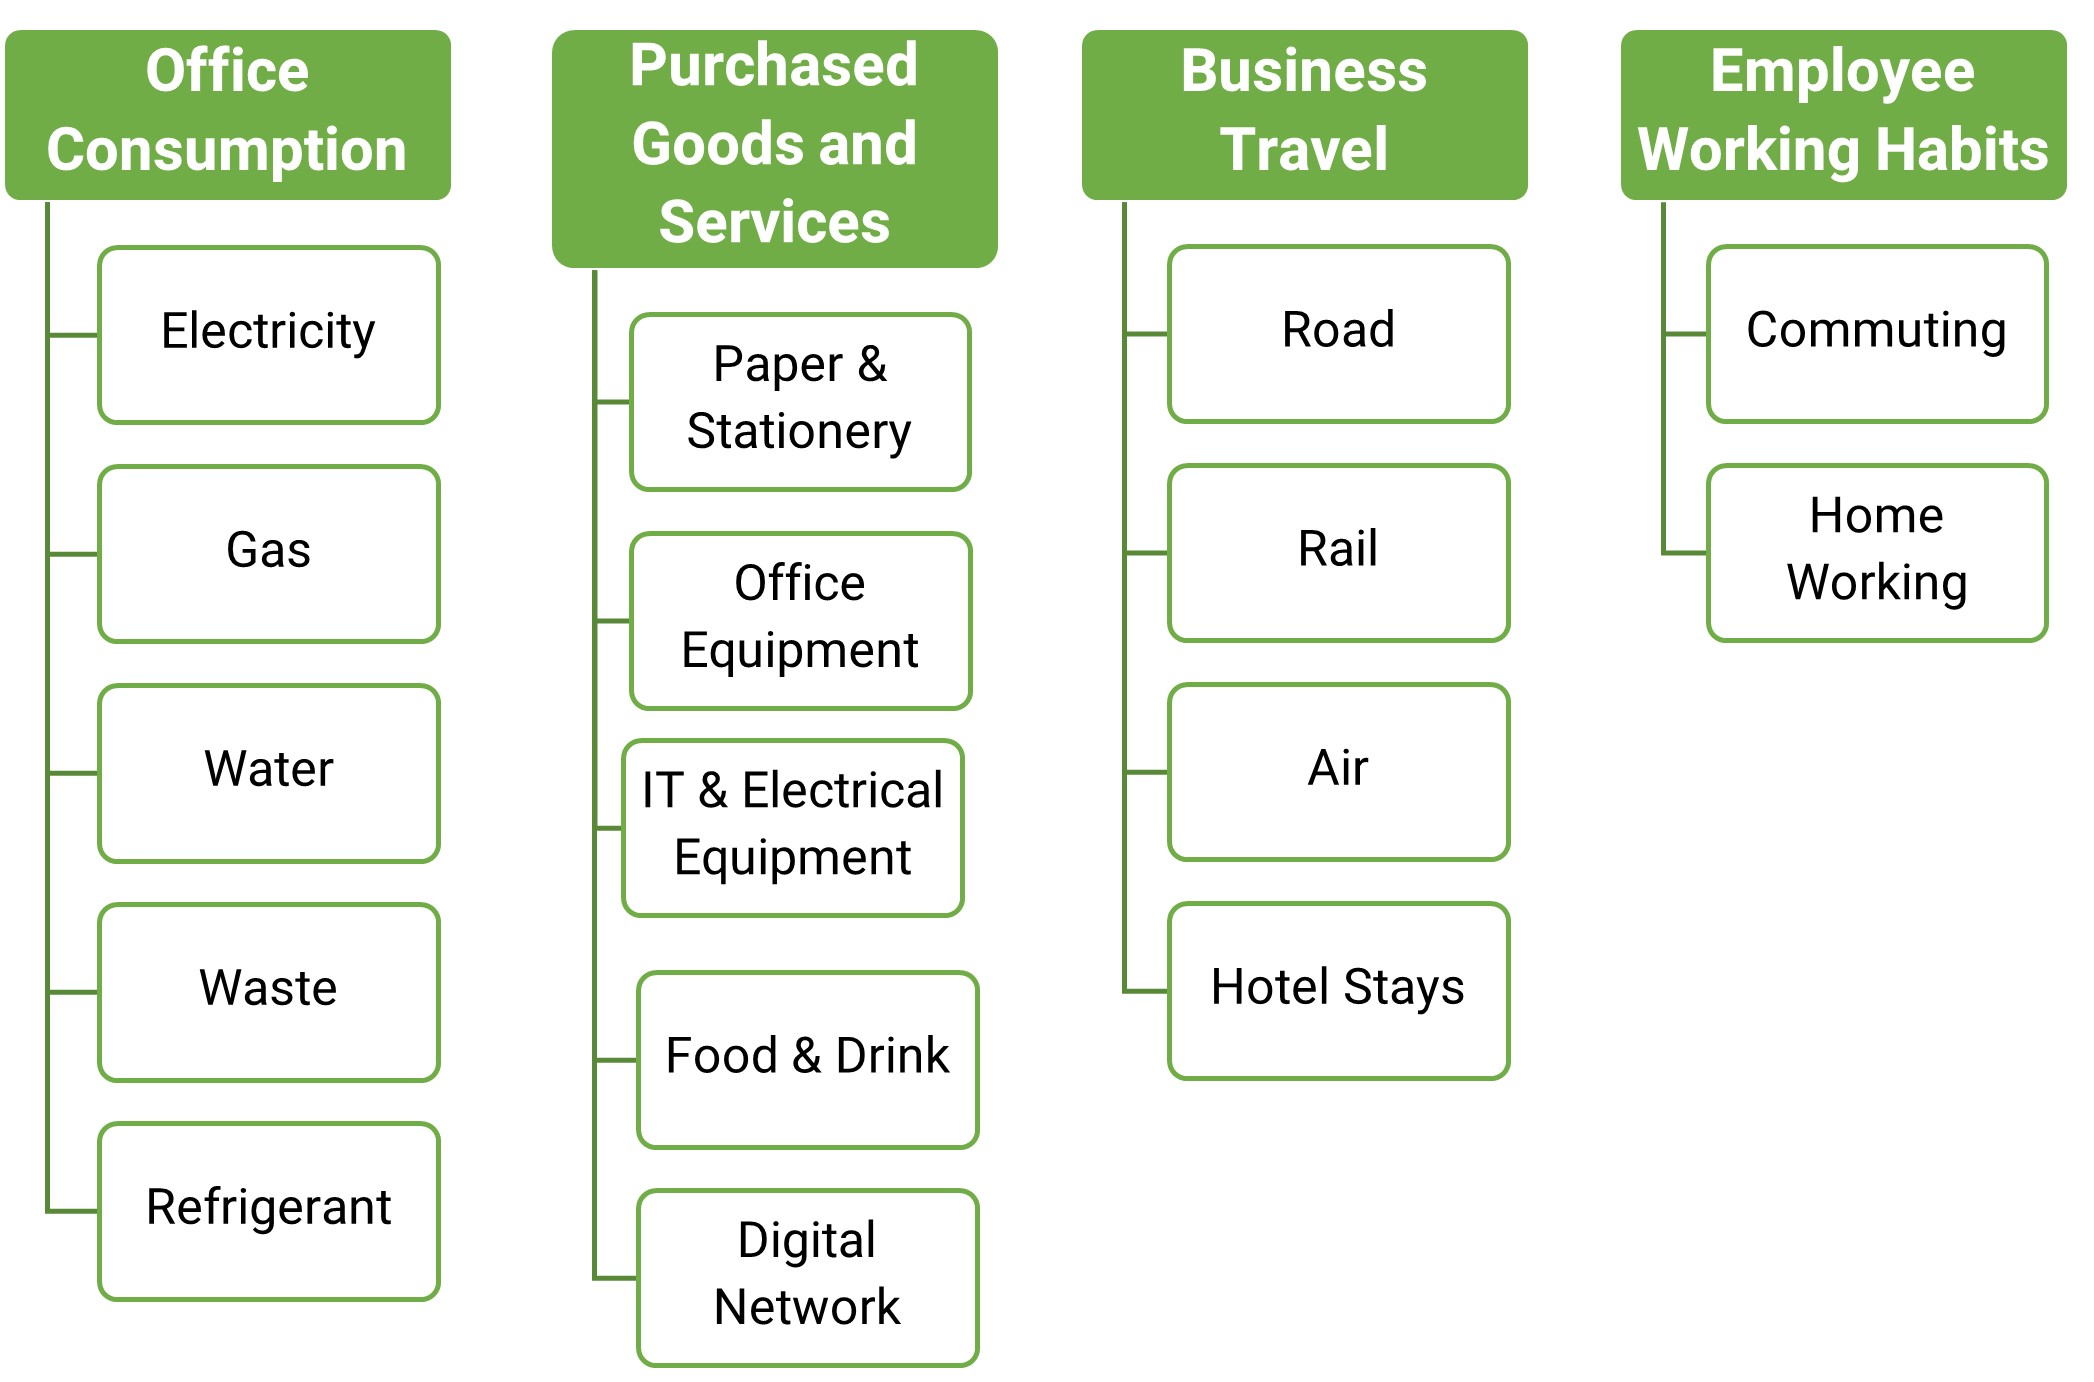
A research sector organisation will in-turn have more simple data, meaning your organisation can streamline the data collection process. As a result, your organisation will avoid the high costs of hiring environmental consultants to process huge volumes of data from your business activities.
Success Story: Differentology
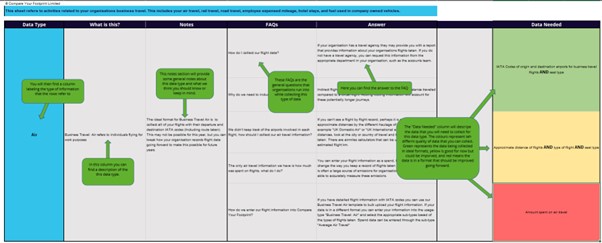
Research Consultancy, Differentology, decided to use Compare Your Footprint’s carbon calculation software in association with MRS's Net Zero Pledge. Once Differentology had subscribed to the software, they had access to the Data Helper Tool. The tool was designed to help organisations understand what data should be included to create a robust carbon footprint within the software.
Example of Compare Your Footprint’s Data Helper Tool
Paige Fiedorowicz, Finance and Admin Assistant at Differentology, created the company’s carbon footprint using Compare Your Footprint: “The tool made the carbon footprint process feel a lot less intimidating. I have never done anything like this before and when we first started using the software we didn’t know where to start – after the tool was released, I was able to work through the data points mentioned in the helper and input the information into Compare Your Footprint. I thought the tool was clear and informative.”
The Data Helper Tool shows organisations how to set up facilities (offices, sites etc) and then how to gather data relating to each of these facilities and employees working within them, such as business travel, procurement, digital footprint, and communal office spaces.
Anyone in your organisation with access to this type of data can then gather the information and start entering it into the software. Differentology created a comprehensive annual carbon footprint report that covered Business Services, Business Travel, Computers, Electricity, Employee Commuting, Food & Drink, Home Working, Hotel Stay, Material Purchased, Refrigerant, Wastepaper, and Water. They are now able to identify their ‘carbon hotspots’ (where most emissions are being generated). The carbon emissions results report has helped Differentology to create a baseline carbon footprint year to set targets from and track progress year-on-year, and focus efforts on the areas with the highest impact. This will also help them on their journey to net-zero.
Jenny Chen, Financial Director at MEL Research also opted to use Compare Your Footprint’s software and benefited from an integration with Xero online accounting to measure their spend data, they also got in touch with suppliers to collect data from them. As a hybrid working organisation, they also made use of Compare Your Footprint’s home working and employee commuting survey to gather information from staff on the type of energy, lighting and devices used in home offices and how they travel to work.
Jenny and her team identified MEL’s carbon hotspots as freight from deliveries, printing, and business travel by road due to face-to-face interviews. They are looking to address this by implementing more online activities.
MEL Research has published its carbon reduction plan as part of the company’s annual financial report. Jenny commented: “Now that we have been through the process, we are much more familiar with what data needs to be collected and how. The next time we need to report it will be a lot easier to include our carbon reduction plan with the new figures. It will help us to see how we are tracking our emissions and meeting our net-zero target.
For further information on getting started:
- View MRS’s webinar recording on How to measure your footprint’ in collaboration with Compare Your Footprint.
- Members of MRS are entitled to a 20% discount on the first year of subscription to Compare Your Footprint. Get in touch at marketingcyf@compareyourfootprint.com for more details.
Case studies
- Cutting through Kellogg’s complex supply chain emissions | The Carbon Trust
- Supporting Vodafone’s Net Zero ambition | The Carbon Trust
- Caravan and Motorhome Club Uses Insight to Plan a Sustainable Future | Case Study | GreenBook.org
- Young Persons’ Free Bus Travel | Net Zero Nation
- Affinity Water ramps up its investment in solar energy as it prepares for net zero
- Does 'yummy' play a role for this alternative-protein source? - TRC Market Research
Get the latest MRS news
Our newsletters cover the latest MRS events, policy updates and research news.


©2026 The Market Research Society,
15 Northburgh Street, London, UK EC1V 0JR
Tel: +44 (0)20 7490 4911 Email: info@mrs.org.uk
The Market Research Society (MRS) is the world's leading research association. For all those who need, generate or interpret the evidence for making good business and policy decisions. Click here to find out more about us.
©2026 The Market Research Society,
15 Northburgh Street, London EC1V 0JR
Tel: +44 (0)20 7490 4911 Email: info@mrs.org.uk