Geodemographics - blogs and resources
Visit the Geodemographics Knowledge Base (GKB) for expert blogs and links to useful sources of geodemographic data and knowledge.
The MRS Census and GeoDems group champions new thinking and new talent; one area they have been particularly impressed with is the CDRC Masters Dissertation Scheme (MDS)
This programme offers an exciting opportunity to link students on Masters courses with leading retail companies on projects which are important to the retail industry. The scheme provides the opportunity to work directly with an industrial partner and to link students’ research to important retail and ‘open data’ sources. The project titles are devised by retailers and are open to students from a wide range of disciplines.
MRS CGG are proud to have been granted permission to publish abstracts from the dissertations and we are sure the students have a great future ahead of them.
The latest abstract is by Catherine Duffy, titled Evaluating the spatial accessibility of COVID-19 vaccination sites in England
Academic Institution: University of Leeds
Industry Sponsor: HERE Technologies
Background and Motivation
The global COVID-19 pandemic has provoked significant changes in the way individuals, organisations and sectors operate, with mitigation and prevention of the virus and its transmission becoming a catalyst for the restructuring of various industries and services, most notably, healthcare. In England, the NHS has been at the forefront of testing, treating and more recently, vaccinating against the novel coronavirus. This necessitated operational and spatial reorganisation at an unprecedented scale. Researchers now have a unique opportunity to investigate and evaluate these responses, to develop knowledge that could help to inform future pandemic planning and policy.
This study represents an early investigation into the spatial distribution of vaccination sites in England and the resultant levels of accessibility experienced by the resident population. This project aimed to analyse the accessibility of vaccination sites in England to its citizens and identify areas in which this accessibility may be inequitable. This aim was addressed through measuring accessibility using traditional distance-based methods and two-step floating catchment area (2SFCA) models. These methods allowed evaluation of the consistency of accessibility to COVID-19 vaccines nationwide, and identification of areas for which access may have been a concern. This study also provides a starting point for discussion on suitable methods for quantifying accessibility in the unique context of rapidly vaccinating a nation.
Data and Methods
Information on the location of vaccination sites in England was collected from the NHS England website, where a full list of vaccination sites was regularly published. The list contained the name, address and postcode of all sites, organised into four site types: hospital hubs, GP-led services, pharmacies and vaccination centres. The iteration of this dataset from the 6th July was used in all analyses. After cleaning, it contained 2,067 vaccination sites, of which 274 were hospital hubs, 911 were GP-led vaccination services, 691 were pharmacies, and 191 were vaccination centres. Hospital hubs were removed from the analysis as the were not available for bookings from the general public. After some data exploration, it also became apparent that many of the GP-led services on the NHS vaccination list only offered vaccines to patients registered at their practice, which often ran on separate schedules to the National Booking Service (through which appointments at vaccination centres and pharmacies were booked and managed). The first stage of the methodology was run both with and without GP-led services in the network, to assess how the ambiguity surrounding GP-led services may have impacted accessibility.
Lower layer super output area (LSOA) population-weighted centroids (PWCs) were used to represent population. They served as demand points or journey origins when measuring accessibility.
Firstly, the nationwide accessibility to COVID-19 vaccination sites was explored through a routing analysis. Latitude and longitude coordinates for both the LSOA PWCs and the centroids of the site postcodes were input into HERE Technologies APIs. The HERE Routing and HERE Public Transit APIs were used to generate routes from the each LSOA to a number of nearby sites, with each request returning information on route length, duration and any required transport mode changes. Key metrics were then calculated for travel distance and time by both car and public transport, taking the closest five sites to each LSOA by drive distance.
HERE’s Isochrone API was used, via the Hqgis plugin for QGIS, to create catchments around each LSOA PWC and vaccination site (designated as 15-minute drive time isochrones in urban areas, or 30-minute isochrones in rural areas). These formed the basis of the 2SFCA
and enhanced two-step floating catchment area (E2SFCA) models.
The aim of the 2SFCA models was to create an accessibility ratio of vaccines-to-population at each LSOA. The model achieves this in two steps. First, vaccine-to-adult population ratios at were calculated at each site, by dividing the site capacity by the total population of all LSOA PWCs that fell within the site catchment area. Then, in the second step, the site ratios were totalled within each LSOA catchment to create a “cumulative opportunity score”. To improve this model into an E2SFCA, a distance decay function was added within the catchment areas.
The results of both the routing analysis and 2SFCA model were evaluated alongside deprivation (using the Indices of Multiple Deprivation or IMD) and rurality (using the Office for National Statistics’ Rural Urban Classification or RUC), to see if the vaccination site network exacerbated the inequalities in access that are traditionally seen in rural and/or deprived areas.
Key Findings
The results indicated that good accessibility was not as widespread as NHS England’s coverage figure of 99.11%, calculated from the number of people living within ten miles of a vaccination site as the crow flies. However, it was not much worse for individuals with access to a private vehicle. As much as 98.5% of the adult population could have driven less than ten miles, or 16.1 kilometres, to reach their closest site, and over three-quarters of the population had at least five sites within this threshold, allowing some personal choice of vaccination location. However, the ambiguity surrounding access to GP-led services created two very different sets of statistics and significantly reduced the potential for any accurate estimations of vaccination journeys.
For those who were reliant on public transport to reach their vaccination appointment, accessibility was less certain. The range of possible travel times was extensive, even when extreme outliers were ignored, and in some cases, public transport routes could not be found. This study also found that between 90,000 and 380,000 people without access to a car lived over an hour away from their closest vaccination site, as of July 2021. Along with public transport users, rural areas and specific regions, such as the South West, were identified as having relatively poor access; however, deprivation and accessibility were not shown to have a strong relationship.
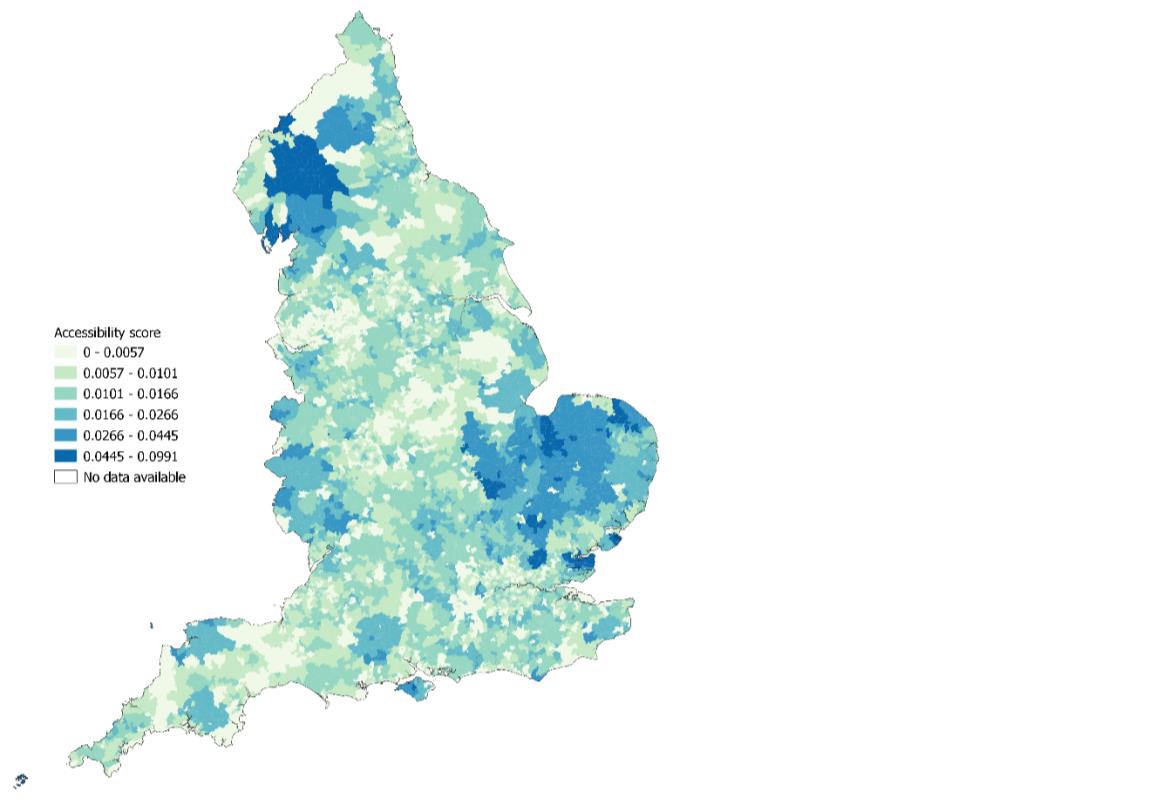
However, the two methods of analysis used in this study produced results that seemed highly contradictory. The E2SFCA model was highly influenced by vaccination centres due to their high capacities. This led to many urban areas scoring poorly. It is likely that the high populations of urban centres also caused this bias towards rural LSOAs. On the other hand, the routing analysis showed that residents of rural areas travelled further and for longer, on average, than their urban counterparts.
Fig 1: LSOA accessibility scores from the E2SFCA model
Value of the research
The results of this research may be useful in future pandemic planning and policy, as inequalities have been identified between regions, users of different transport modes and population densities. By using two methods with different focuses, this report can advise on the future development of similar vaccination site networks, focussing on areas with particularly long travel times and those with poor supply-demand ratios. It is also hoped the methodology presented here can serve as a foundation for more focused studies, using more robust models or smaller case study areas

Visit the Geodemographics Knowledge Base (GKB) for expert blogs and links to useful sources of geodemographic data and knowledge.
Our newsletters cover the latest MRS events, policy updates and research news.


©2025 The Market Research Society,
15 Northburgh Street, London EC1V 0JR
Tel: +44 (0)20 7490 4911 Email: info@mrs.org.uk
The Market Research Society (MRS) is the world's leading research association. For all those who need, generate or interpret the evidence for making good business and policy decisions. Click here to find out more about us.
©2025 The Market Research Society,
15 Northburgh Street, London EC1V 0JR
Tel: +44 (0)20 7490 4911 Email: info@mrs.org.uk
0 comments