Geodemographics - blogs and resources
Visit the Geodemographics Knowledge Base (GKB) for expert blogs and links to useful sources of geodemographic data and knowledge.
Student Name (Institution): Samuel Li (University College London ,UCL)

Academic Supervisor (Institution): Dr Maurizio Gibin (University College London ,UCL)
Retail Sponsor (Institution): Christian Tonge (Movement Strategies)
Retail Sponsor Logo:
Shipping forms the backbone of the globalised world economy, sustaining the quality of life for much of the global population. Despite the large technological advancements in shipping and port infrastructure, the shipping network is still impacted by extreme weather. Understanding how shipping activity changes in relation to extreme weather conditions is important for developing the policies and regulations needed to create a more resilient shipping network. The information needed has become more accessible with the increasing availability of Automatic Identification System (AIS) and weather API data. Within this context, this investigation assesses the influence of extreme weather on the spatial distribution and operational behaviour of the North Sea shipping network using AIS and weather API data.
The AIS dataset is composed of 488,989,498 records ingested from 24-01-2020 to 30-04-2020. Samples for calm and extreme weather conditions are extracted from the dataset using the weather API data by applying a criterion of gust speed, wave height and precipitation. Records belonging to cargo and tanker vessels are filtered for analysis. The AIS data is explored through three methods: geofencing, traffic density mapping and network analysis. Geofencing uses polygons to group the AIS point data, creating shipping statistics that measure shipping and port activity. Traffic density mapping converts AIS point data into gridded vessel route density maps that plot the spatial distribution of vessel traffic density. Finally, the AIS point data is converted into a spatially representative network graph using complete hierarchical clustering and the Dijkstra’s shortest path algorithm so the network size, complexity, and connectivity can be measured using network analysis techniques. The difference between the calm and extreme weather samples are then compared to quantify the impact of extreme weather. The independent t-test is used to compare the shipping and network statistics while the local Getis-Ord G* hotspot analysis is used on the traffic density maps.
Results from the analysis confirm that extreme weather causes an overall decrease in shipping activity within the North Sea. The shipping statistics show that shipping activity in the North Sea follows a hub-and-spoke model that is centred around a few busy ports and routes, while the rest of the maritime hinterland has very little activity. Extreme weather causes a general reduction in extra-basin activity, port activity and shipping activity (Figure 1).
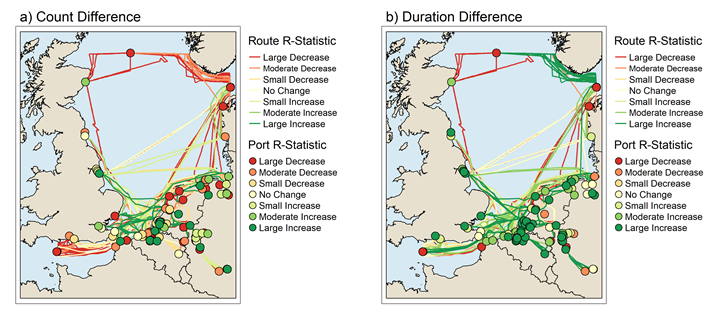
Figure 1: Map for the differences in port stop and route journey a) count and b) duration (minutes) according to the r-statistic.
The traffic density maps reveal that shipping density is highest in the southern North Sea along the coast of the European mainland from the English Channel to Skagerrak. Extreme weather results in a decrease in shipping activity throughout most of the North Sea, with some pockets of increased activity (Figure 2).
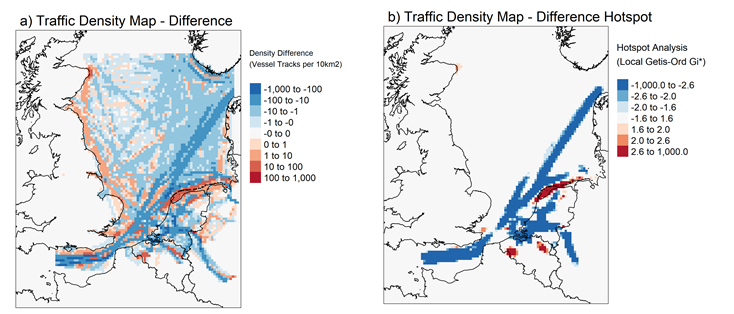
Figure 2: A (a) traffic density map and a (b) hotspot analysis map for the difference between calm and extreme weather.
The network analysis supports the findings from the shipping statistics, which indicates that the few central ports in the North Sea shipping network are vital to the efficient functionality of the network. Extreme weather causes the shipping network to decrease in size, complexity, and connectivity during extreme weather (Figure 3).
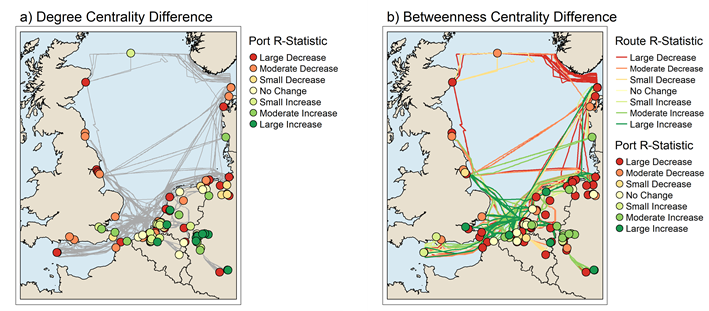
Figure 3: Map for the differences in port and route a) degree and b) betweenness centrality according to the r-statistic.
Interactive maps of the results can be found at: https://jdfj3.shinyapps.io/Dissertation/.
Overall, the investigation has successfully developed a workflow that converts raw AIS data into useful data products. These products can help map and quantify the impacts of extreme weather on shipping, providing a better understanding of its economic impacts and support hazard mitigation planning. It also lays the groundwork for an extensive range of future potential work that can greatly increase the usefulness of AIS data in maritime planning. The statistics produced can act as precursors for further analysis, such as for establishing clear relationships between shipping activity and various covariates. It also improves the visualisation of AIS data and aids in its interpretation, potentially increasing its use cases.

Visit the Geodemographics Knowledge Base (GKB) for expert blogs and links to useful sources of geodemographic data and knowledge.
Our newsletters cover the latest MRS events, policy updates and research news.


©2026 The Market Research Society,
15 Northburgh Street, London EC1V 0JR
Tel: +44 (0)20 7490 4911 Email: info@mrs.org.uk
The Market Research Society (MRS) is the world's leading research association. For all those who need, generate or interpret the evidence for making good business and policy decisions. Click here to find out more about us.
©2026 The Market Research Society,
15 Northburgh Street, London EC1V 0JR
Tel: +44 (0)20 7490 4911 Email: info@mrs.org.uk
0 comments