Geodemographics - blogs and resources
Visit the Geodemographics Knowledge Base (GKB) for expert blogs and links to useful sources of geodemographic data and knowledge.
The MRS Census and GeoDems group champions new thinking and new talent; one area they have been particularly impressed with is the CDRC Masters Dissertation Scheme (MDS)
This programme offers an exciting opportunity to link students on Masters courses with leading retail companies on projects which are important to the retail industry. The scheme provides the opportunity to work directly with an industrial partner and to link students’ research to important retail and ‘open data’ sources. The project titles are devised by retailers and are open to students from a wide range of disciplines.
MRS CGG are proud to have been granted permission to publish abstracts from the dissertations and we are sure the students have a great future ahead of them.
The latest abstract is by Antony Rodgers, titled Mapping Cities as Flows: An evaluation of mobile app-based trajectory data for the modelling of origin destination flows.
Academic Institution: University of Liverpool
Industry Sponsor: Carto
Background and Motivation
This project proposes a framework to better understand how people flow in and out of cities and the transport mode they choose. The opportunities for investigating the movement of people are becoming more abundant due to the pervasiveness of mobile location aware technologies (e.g., smartphones). These mobile devices produce constant streams of spatial data through time. This study leverages mobile-app based trajectory data to evaluate origin-destination (OD) flows. OD flows have the value of summarising patterns across geographic regions, which is valuable for informed decision making. In order to obtain these benefits, an end-to-end approach that identifies individual journeys, infers the mode of transportation and facilitates the visualisation of OD patterns is presented.
The motivation is that by creating an end-to-end framework, it can be designed to be scalable, robust, consider performance and provide meaningful OD flow output. The meaningful interpretation of OD flows grouped by transport mode enhances practical application in solving real-world problems (e.g., geographic modal share/ shift of transportation usage).
Data and Methods
This study included the use of 2 primary datasets: a labelled one for training a transportation mode classifier and an unlabelled one for testing and visualising the output. It also leveraged external contextual spatial data.
The Test dataset consisted of an unlabelled collection of 4,995,377 GPS points located in Washington DC and it’s surrounding region. It is attained from mobile apps with opt-in consent from users. The Training dataset consist of a labelled collection of 3,334,971 GPS points located in Beijing. It was collected for a period of over 4 years using GPS loggers. The attribution for both datasets contained an anonymous uid, latitude, longitude and timestamps. The external spatial data consisted of OpenStreetMap transport network data (railway lines, bus routes, highways) and Uber’s H3 hierarchical spatial index. H3 is used to aggregate the OD flows to help identify patterns, it also obfuscates individual GPS locations to ensure geoprivacy is prioritised.
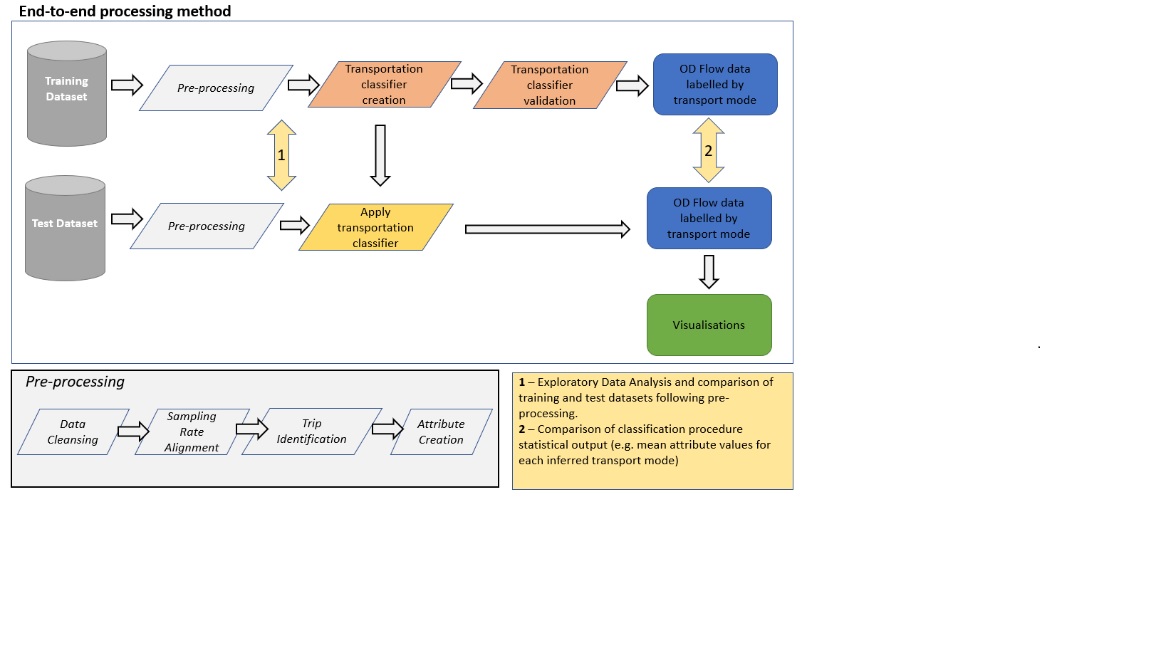
The method consisted of 4 key steps. First was pre-processing, which cleansed the data, inferred individual user journeys (trips) and generated attributes on the trips (e.g., velocity, spatial proximity to transport network). Second was to build a transportation classifier which was a novel method combining machine learning (a random forest (RF)), heuristics and spatial arrangement of the data to infer transport modes (bus, car, walking and train). Third was to evaluate the transport classifier in order to gauge its performance. Finally, the transport classifier was implemented on the unlabelled Test data and observed though map visualisations showing aggregated OD flows.
Figure 1: Workflow Design for the Proposed Framework
 Key Findings
The results of the rules-based classifier on the Training data identified train trips with a recall of 69% and a precision of 81%. The recall accuracy represented 362 correctly allocated train trips as a proportion of 522 actual train trips in the dataset.
The results of the RF classifier (Figure 2) revealed car trips show the lowest recall accuracy at 78.7% and walking trips the highest at 88.9%. RF incorrectly identifies 178 walk trips as bus trips and 144 bus trips as walk trips (FN). This suggests these 2 transport modes are the most likely to be mistakenly assigned.
There was encouraging evidence to suggest that when both classification steps were implemented (heuristics first, followed by RF), they effectively allocate transport labels. The overall accuracy score after both classifications were performed was 82%.
When the end-to-end processing framework was performed on the Test dataset and data was labelled and aggregated into OD flows it demonstrated discernible patterns for the Test area regarding transport mode (Figure 3).
Value of the research
There is a lack of available labelled GPS datasets for transport mode. This research suggests that the inclusion of contextual spatial data helps produce a robust classification process, functional in locations other than that which it was trained.
This research shows evidence that georeferencing local transport networks using H3 can provide similar benefits to Euclidean distance calculations. This is valuable knowledge because it can be precalculated, allowing the process to run faster and be applicable in a real-time processing framework.
Grouping OD Flows by H3 is an effective way to produce OD matrices at different scales. These facilitate clear identification of patterns across space. These patterns are valuable for traffic management, location-based mobility services, and transport planning.
Figure 2 - Confusion matrix heatmap for RF classifier.
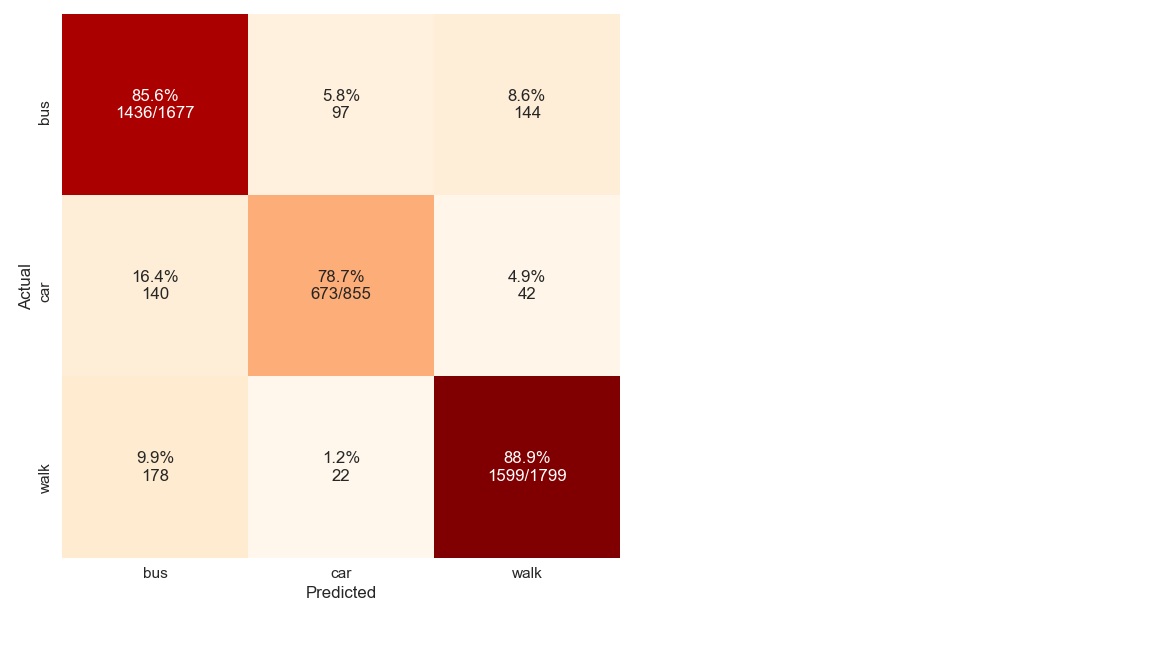
Figure 3 - Top 10 highest frequency Origin Destination flows per transportation mode in Washington DC CBD (bus, walk, car)
Figure 4 - Map of aggregated OD Flows for all transportation modes in Washington DC and surrounding region.

Visit the Geodemographics Knowledge Base (GKB) for expert blogs and links to useful sources of geodemographic data and knowledge.
Our newsletters cover the latest MRS events, policy updates and research news.


©2026 The Market Research Society,
15 Northburgh Street, London EC1V 0JR
Tel: +44 (0)20 7490 4911 Email: info@mrs.org.uk
The Market Research Society (MRS) is the world's leading research association. For all those who need, generate or interpret the evidence for making good business and policy decisions. Click here to find out more about us.
©2026 The Market Research Society,
15 Northburgh Street, London EC1V 0JR
Tel: +44 (0)20 7490 4911 Email: info@mrs.org.uk
0 comments